ARTICLE WRITTEN BY BOB ROBERTS OF STEWART TITLE
New Housing Construction
Whether for owner-occupied properties or rentals — is a risky business. Just like the story of Goldilocks and the three bears, the question is, “Are we building too much new housing, not enough or is current construction just right?“
New housing construction for owner-occupied and rental housing has an inherent risk given the time required from recognition of demand to actual delivery of the housing unit to the market. The economy can change significantly in that period either up or down resulting in overbuilding the market or undersupplying demand. Accurate information for the amount of construction in the pipeline in unavailable. Missing too is demolition data.
Current job growth explains why the U.S. economy is so resilient today. Not only are there more jobs than at any time in history, incomes posted the best increases in a decade in 2019. With a healthy and growing economy comes an increasing demand for housing since jobs enable effective purchasing power. Demographic growth creates demand for real estate, but without income (primarily from jobs) it remains unfulfilled demand. There is a big difference between wanting something and actually being able to purchase that want.
The following table shows net job growth and total U.S. residential building permits issued annually since 1995. Employment data are from the U.S. Bureau of Labor Statistics and residential building permits from the U.S. Census Bureau (with the data accessed via the Real Estate Center at Texas A&M University). The data for 2019 is the latest 12-months as of October and serves as a proxy for the year. Jobs and residential permits do diverge over time. In 2002 there were 1.772 million dwelling units permitted to be constructed despite a loss of 825,000 jobs that year and 897,000 in the prior year.

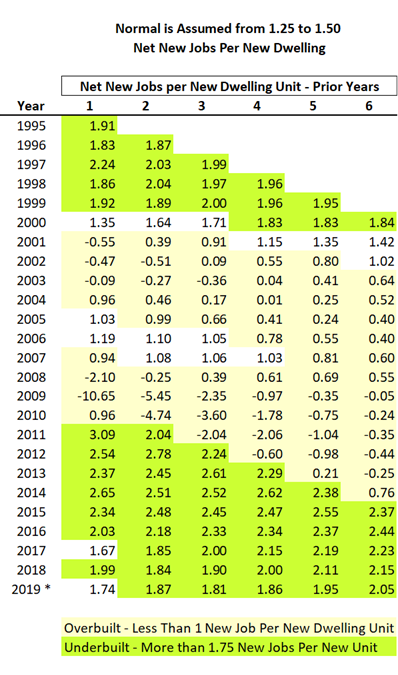
The next table shows the total number of net new jobs per new residential dwelling unit (proxied by building permits issued). These were calculated for intervals from one to six years. We know that most of the permits issued in one year will not be completed until the next, so a one-year direct comparison tells little about the relative change in the supply of housing and effective demand. My premise is that each new dwelling unit economically needs from 1.25 to 1.50 net new jobs. One or less net new jobs per new dwelling unit signals the market is overbuilding while more than 1.75 net new jobs per new dwelling indicates an undersupply. In 2000, for example, there were 1.35 net new jobs created for each new dwelling permit issued. That would indicate a market in equilibrium since it is within the 1.25 to 1.50 net new jobs per new dwelling unit. When expanding the period to include a six-year interval in 2000 (from 1995 through 2000), there were 1.84 net new jobs per new dwelling unit signaling an undersupplied market. Essentially there was some pent-up demand carrying forward from prior years. The reverse was true, no doubt, in 2009 when the country lost 6.227 million net jobs but still added almost 600,000 net new dwelling units.

While 2019 shows a declining number of net-new jobs per new residential building permit issued compared to the prior year for all but one of the durations from one to six years (the two-year period), it remains in the underbuilt – undersupplied range. When it comes to the appropriate time interval, one-year of data is too short and six years more than adequate.
The next table is identical to the prior but is color-coded to indicate whether the market is Overbuilt (less than 1.0 net new jobs per new dwelling) or Underbuilt (more than 1.75 net new jobs per new dwelling unit). The few colored data points show how elusive it is to economically match new demand with new housing supply.

Construction & Demolitions
To view residential building permit data available via the Real Estate Center at Texas A&M University for all of the U.S., states, Metropolitan Statistical Areas click here
A missing key data point is the number of demolitions. The American Housing Survey reported that 1,699,000 homes left the housing stock either permanently or temporarily from 2009-2011. Outright demolitions accounted for 519,00 units or an average of 173,000 razed dwellings per year. These uncounted demolitions equal 23 percent of all new residential building permits issued in the 12-months ending October 2019. Thus the data and metrics above overstate incremental housing stock each year. This does not include conversions of residential properties to alternative uses nor those temporarily damaged by events such as fire, floods, tornadoes or hurricanes.
How many new dwelling units should be constructed annually to make Goldilocks happy? Assuming 1.50 net new jobs per new dwelling unit as the sweet spot, new residential building permits should be approximately 1.47 million annually assuming an ongoing 2.2 million net new jobs annually — the number reported in the latest U.S. jobs report. With 1.225 million total residential building permits issued in the prior 12 months, the market was undersupplied by one-quarter million dwelling units.
The U.S. continues to under-build the market today and that is reflected in rising home prices and rents as demand outpaces supply. From a housing construction perspective, we are still searching for that just right bowl of porridge, a properly sized chair, and a supporting mattress.
Merry Christmas!
BOB ROBERTS
Senior Vice President | Stewart Title of Austin, LLC
901 South Mopac, Building III, Suite #100
Austin, TX 78746
O (512) 322-8709 | M (512) 775-5111
stewart.com/austin | bob.roberts@stewart.com | View My Profile
The service that Marcus provides to his clients is unparalleled. He is a true professional.

Related Articles
Real Estate Market Update 12/10/2019
Are we headed to a recession? While we survived the year of RECESSION OBSESSION without a...
Real Estate Update 12/5/2019
Mortgages Mortgage application volume decreased 9.2% from the previous week, according to the...
Weekly Update: Rental Home Supply is Shrinking
CoreLogic Reports Low Rental Inventory Levels are Pushing Rent Prices Up —U.S....
Sponsoring Broker:
Compass RE Texas LLC
call: 512 575 3644
visit: 801 Barton Spgs Rd, 6 Floor
Austin, TX // 78704
site: compass.com
Information About
Brokerage Services
Texas law requires all license holders to provide the Information About Brokerage Services form to prospective clients.
Click here
Consumer Protection
Act Disclosure
Texas law requires all license holders to provide a link to the Consumer Protection Notice form to prospective clients.
Click here
All right reserved Marcus Roper 2019
Marcus Roper is a licensed Realtor in the State of Texas
and an agent of Compass Real Estate, LLC


Subscribe To Our Newsletter
Join our mailing list to receive the latest news and updates from our team.
You have Successfully Subscribed!
or email info@westhorn.com